
Creating a Rolling Average & Rolling Total using Power Query.
- Marek Vavrovic
- Jun 10, 2021
- 5 min read
Updated: Jun 12, 2021
A rolling average also known as moving average is a statistical method that calculates the average of a data series for a given period. Rolling average has a wide usage. Especially in financial markets where traders or investors use this method to estimate stock prices. Also, rolling average assists to determine or estimate direction of trends and so it increases the right decision probability. The main idea of this method is to determine trends and track the trend.
Calculating a Rolling Average for a specified time period
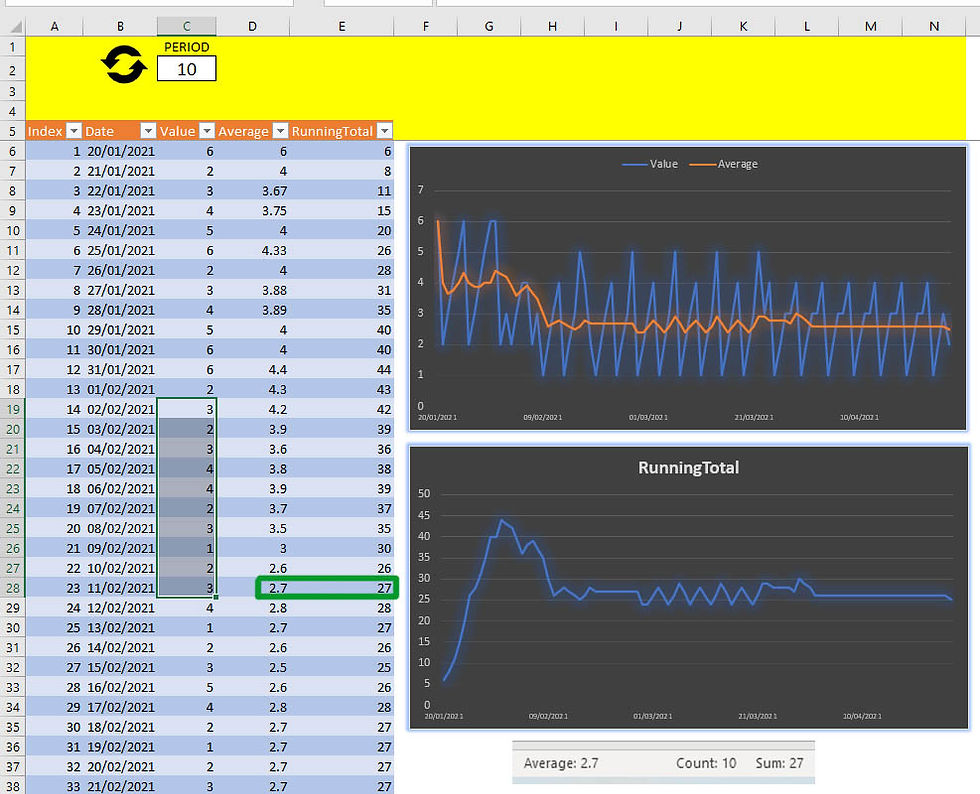
Data: I do not want to hardcode the value specifying the number of days for which is the rolling average calculated. Create a parameter using Define Name. You can use Define Name or Table for the Power Query. In this step I have already created one.

Step 1: Click on the number 7, Data > From Table\Range.
Range refers to a Define Name in the VBA. If you want to crate a Define Name in VBA use RANGE.
Step 2: Right click on the cell value > Drill Down
This will create a query we use to manipulate the value in the Moving Average Formula. Instead of 7 days moving average we have Value Days Moving Average.
Close & Load To...Only Create Connection.

Step 3: Import the data table in to Power Query.
Step 4: Use a function calculating 7 days moving average...
Average= Table.AddColumn(ChangedType, "Average", (x)=> List.Average(
Table.SelectRows(ChangedType,
each ([Date]<=x[Date] and
[Date]>= Date.AddDays(x[Date],-6)))[Value]),type number)
Table.AddColumn: M code function for adding a new column "Average"
ChangedType previous step
"Average" new column name
Table.SelectRows: function for selecting the rows we want to work with
List.Average: bilt-in function for calculating the average [V1+V2+V3/number of values]
(x) => function
x[Date] external table from memory.
Date.AddDays(x[Date],-6)))[Value] we want to calculate 7 days average. Power Query is based 0. That means it creates an index in the memory which stars from zero {0,1,2,3,4,5,6)} and returns the previous 7 days to calculate the average.

Step 5: Load it into Excel. I have created 2 charts. Top one is 7 days moving average created by Excel, bottom one has data from Power Query and both are identical.

Step 6: Adding a variable to Date.AddDays(x[Date],-6))) function.
In this step we will go back to the Power Query to replace number "-6" with the Query Path I have previously created.
Average=Table.AddColumn(ChangedType, "Average", (x)=> List.Average(
Table.SelectRows(ChangedType,
each ([Date]<=x[Date] and
[Date]>= Date.AddDays(x[Date],-Value+(1))))[Value]),type number)

Load it into Excel, enter the value you want and refresh the data set.

VBA code to refresh data connection (data table)
Sub Table_Refresh()
ThisWorkbook.RefreshAll
End Sub
If you want to round the number you can use Number.Round() This function takes 2 arguments, 3rd one is optional.
M code:
Table.AddColumn(ChangedType, "Average", (x)=> Number.Round(List.Average(
Table.SelectRows(ChangedType,
each ([Date]<=x[Date] and
[Date]>= Date.AddDays(x[Date],-Value+(1))))[Value]),2),type number)
Calculating a moving / rolling / running TOTAL per specified period
This formula will calculate the running total for the entered period of time. For example if you enter 10 it will sum up the values for the last 10 days for each row.
Table.AddColumn(Average, "RunningTotal", (g)=>List.Sum(Table.SelectRows(Average,
each([Date]<=g[Date] and [Date]>= Date.AddDays(g[Date],-Value+(1))))[Value]),type number)
Average: previous step name

Calculating SUM by month
Step 1: Add Name of Month
Step 2: Use the function
If you will copy&paste the function you need to change the name of the previous step and function letter.
SumByMonth= Table.AddColumn(AddMonth, "MonthTotal", (e)=>List.Sum(Table.SelectRows(AddMonth,
each([Month]<=e[Month] and [Month]>= e[Month]))[Value]),type number)

In this data set I have just data for 3 months in the same year. If I would added more data to it +2 years this formula will not calculate the sum correctly. For example January for each year would have the same values. To calculate for each month in a different years, change the formula as follow:
SumByMonths= Table.AddColumn(AddMonth, "MonthTotal", (e)=>List.Sum(Table.SelectRows(AddMonth,
each(Date.Year([Date])= Date.Year(e[Date]) and [Month]<=e[Month] and [Month]>= e[Month]))[Value]),type number)
Basically, what we are doing here is calculating the sum for a subcategory.
Creating a Rolling Total for all the data
Will be using 2 functions:
List.Range()
List.Range(list as list, offset as number, optional count as nullable number) as list Returns a subset of the list beginning at the offset list. An optional parameter, offset, sets the maximum number of items in the subset.
List.Sum()
List.Sum(list as list, optional precision as nullable number) as anyReturns the sum of the non-null values in the list, list. Returns null if there are no non-null values in the list.
Step 1: add a custom column, use this function: List.Range(SumByMonth[Value],0,[Index])
SumByMonth: this is the previous step
[Value]: a column with our values
0: offset
[Index] : this is an index column. Must start from 1, increment by 1.
List.Range generates a subset of the list beginning at the offset list. Each row is containing all the previous values. If we add List.Sum() it will sum up these values for each row. This is how we will get the running total.

Step 2 : adding List.Sum() function
= Table.AddColumn(SumByMonth, "RunningTotal", each List.Sum(List.Range(SumByMonth[Value],0,[Index])),type number)
type number: change the data type to number

Creating Running total for each months
I am still working with the same data keeping all the columns.
Step 1: I am going to group them by Year and Month column. I already have month column, need to create Year column. Click on the [Date] column > Add Column > Year.
Step 2: Group by Year and Month > Operation: ALL ROWS. New column name: Sales.

Step 3: is very easy...(in 3 steps)
We are going to add the function. This function needs 3 steps to be added.
3.1 add Index starting from 1, increment 1
3.2 add step that will use this index to calculate the running total
3.3 call the function
Ok.. get the comma ), on the the end of the last step and start writing the function as you can see on this picture.
fxFunction is our function and it is going to run on a table _table
3.1 we are going to add the index
Table.AddIndexColumn(table as table, newColumnName as text, optional initialValue as nullable number, optional increment as nullable number, optional columnType as nullable type) as tableM Code
fxFunction=(_table as table) as table =>
let
HelpIndex=Table.AddIndexColumn(_table,"HelpIndex",1,1 ,Int64.Type)
in
HelpIndex is the name of the first step inside the function. Use any name.
"HelpIndex" is the new column name

3.2 adding the step that will calculate running total inside the grouped table for each month
fxFunction=(_table as table) as table =>
let
HelpIndex=Table.AddIndexColumn(_table,"HelpIndex",1,1 ,Int64.Type),
CalcRT=Table.AddColumn(HelpIndex, "RunningTotalFinal", each List.Sum(List.Range(HelpIndex[Value],0,[HelpIndex])),type number)
in
CalcRT
[HelpIndex] this is the new Index column "HelpIndex" we have created in the 3.1 step.
In 3.2, which starts from CalcRT, we are referencing the previous step HelpIndex.

3.3 add a step, that will call fxFunction() using Table.TransformColumns
Table.TransformColumns(table as table, transformOperations as list, optional defaultTransformation as nullable function, optional missingField as nullable number) as table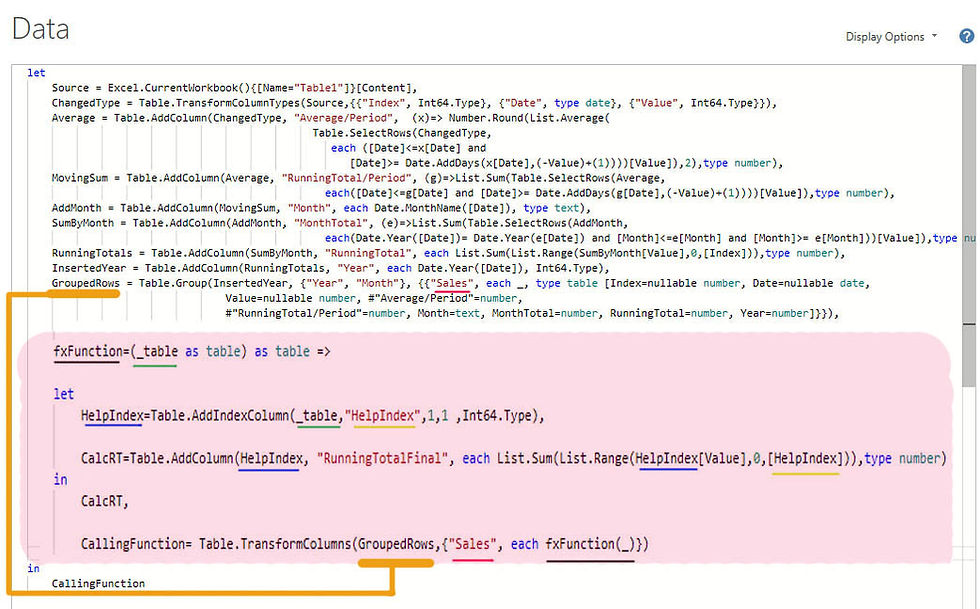
CallingFunction= Table.TransformColumns(GroupedRows,{"Sales", each fxFunction(_)})
CallingFunction : new step name, use any name.
GroupedRows : last step before we have started writing the function body
"Sales" : Step 2: Group by Year and Month >New Column Name: "Sales"> Operation: All Rows
If you click on any row in the Sales column you can see the HelpIndex starting from 1 for each month and the RunningTotalFinal calculated from the Value column.

Step 4: Expand the table, keep columns you need.
Step 5: Load it to Excel or Data Model.

Yo can add this code after the step 2: Group by
It calculates the running total correctly for each month (subcategory) within each year (category)
fxFunction=(_table as table) as table =>
let
HelpIndex=Table.AddIndexColumn(_table,"HelpIndex",1,1 ,Int64.Type),
CalcRT=Table.AddColumn(HelpIndex, "RunningTotalFinal", each List.Sum(List.Range(HelpIndex[Value],0,[HelpIndex])),type number)
in
CalcRT,
CallingFunction= Table.TransformColumns(GroupedRows,{"Sales", each fxFunction(_)}),
#"Expanded Sales" = Table.ExpandTableColumn(CallingFunction, "Sales", {"Date", "Value", "Average/Period", "RunningTotal/Period", "MonthTotal", "RunningTotal", "RunningTotalFinal"}, {"Date", "Value", "Average/Period", "RunningTotal/Period", "MonthTotal", "RunningTotal", "RunningTotalFinal"}),
#"Changed Type" = Table.TransformColumnTypes(#"Expanded Sales",{{"Date", type date}, {"Value", type number}, {"Average/Period", type number}, {"RunningTotal/Period", type number}, {"MonthTotal", type number}, {"RunningTotal", type number}, {"RunningTotalFinal", type number}})
in
#"Changed Type"
Final result

This table contains 685 rows and 5 calculated columns. File size is 79KB.
The refresh time takes about 10-12 seconds.


I am struggling with this as I keep getting [Function] result when I try to apply the steps to creating an 8-week rolling total with my data. I think I must be doing something worng, could you please help? Thanks!
Excellent! Yesterday I spent 5 hours looking for a rolling 6 rows average and was very close but missed the x[Date] reference. Thanks for explaining very well and sharing this advanced real-life PQ problem.